Do you love graphs? This one speaks for itself and is very timely. Hate graphs? Let's walk through this one carefully.
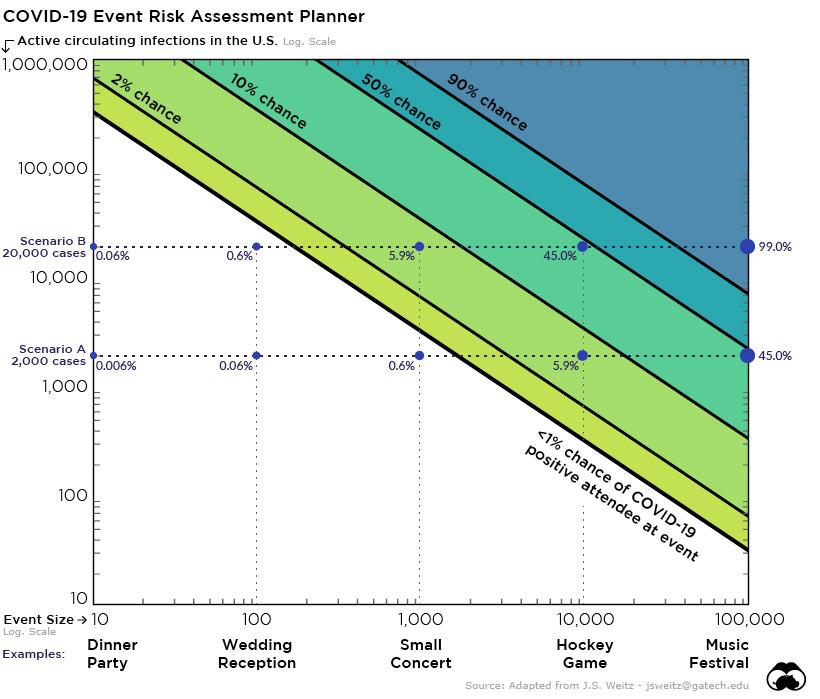
The graph describes the probability of an attendee at an event getting infected with the particular Coronavirus causing the COVID-19 pandemic. That risk is described the the color of the different "zones" on the chart. White is safe (lower left-hand corner). Dark blue is dangerous (upper right hand corner).
Two variables are used in the model. The first, shown on the vertical scale, is the number of ACTIVE INFECTIONS in the entire USA. The second, on the horizontal scale, is the NUMBER OF INDIVIDUALS AT AN EVENT.
NOTE: these are what we call "logarithmic scales". Moving along this kind of scale by equal distances "on paper" or "on your screen" does not change the variables by equal increments. Instead, it changes the variable by equal multiplicative factors. Note the numeric labels at equally spaaced distances. Each is larger than the previous by a factor of ten: 10, 100, 1000, 10000, 100000... These scales are of vital importance when discussing phenomena for which variables range from small numbers to extremely large ones (simply stated).
Let's examine the four corners initially. Lower left: very small number of infections nationwide, very small gathering. You are safe at this gathering, very unlikely to get infected.
Opposite corner: very large number of infections (although scale only goes to 1 Million, or 0.3% of all americans), and a very large gathering (scale goes to 100 thousand). Your chances of getting infected are well over 90%.
Other corners: upper left - country has lots of infections, but gathering is very small. The risk is above 2%. Lower right: very large gathering, but low number of infections in the USA - you're quite safe.
What's NOT present in the model used to generate this graph: A LOT. Is social distancing used? Are attendees wearing masks? What kind of masks? Have they been screened prior to attending? Is this an open air event, or is it in an enclosed space? If in an enclosed space, what sort of air circulation and filtration system is present? How long does the gathering last? Are individuals wandering about, mingling, spending many seconds (minutes?) in contact with lots of other attendees, or are they stationary most of the time, surrounded by a small number of individuals (as in... airplanes)? During entry, waiting, and exit: are there packed, dense crowds?
If you're still with me, let's agree on a conclusion or two. (a) if you attend a large gathering, TRY to improve your chances and those of people around you (in case you are an asymptomatic carrier) by wearing a mask and striving to maintain social distance. (b) When evaluating or even speculating about whether events have caused infections, keep the chart in mind - and remember the factors EXCLUDED from the chart that will alter actual probabilities. (c) If I was able to locate this information, then it seems likely that experts in the Trump campaign also have access to this. We're not talking about a loosely organized blend of diverse protesters. This is the President of "The World's Most Powerful Country", surrounded by "The finest and brightest experts in the world" (?!?).
Context: I am posting this blog entry the day after Juneteenth, 2020. We've watched as certain countries have endured enormously different levels of infections as the COVID-19 pandemic spreads. Experts have repeatedly stated that these different outcomes reflect, among other factors, the response determined by authorities.
We have also, in the USA, been experiencing the most widespread, most visible, vocal and widespread series of protests against systemic racism and systemic violence in many decades. Amidst all this, President Trump has scheduled his first campaign rally in three and a half months for Tulsa, Oklahoma. Originally scheduled to take place on "Juneteenth", the holiday celebrating the de-facto liberation of the final population of slaves remaining three years after their legal emancipation, Trump agreed to change the date - by 24 hours. Tulsa is the city in which, 99 years ago, the United States witnessed the most horrific act of domestic terror on record. An attack using bombs dropped from civilian airplanes, killing hundreds, destroying millions of dollars worth of property, leaving 8,000 black americans homeless. 6,000 of those were then interned in (essentially) prison camps.
These words are being typed 2.5 hours before the rally begins. History will determine the ultimate significance. This blog entry documents the fact that this rally is being held despite the very well documented risk of triggering thousands of new COVID-19 infections, particularly given the tightly packed crowd which are somewhat likely to follow their leader's example by not wearing masks.
No comments:
Post a Comment